ویدیو
Halden Stories
رایگان
دستهبندی
- نمایش پرامپت رایگان — متن کامل پرامپت همین حالا و بدون خرید باز میشود.
- این سایت رو میخوام — همان آیتم بهصورت یک سایت آمادهٔ انتشار، طراحی و راهاندازیشده. قیمت: تومان 5.000.000
Halden Stories
MS-TEM-457متن زیر را کامل کپی کنید و در نسخهٔ Pro ابزارهای Claude Code یا GPT Codex بچسبانید تا همان صفحه ساخته شود. بدون اشتراک Pro این ابزارها، پرامپت کامل اجرا نمیشود.
# Prompt: Halden Stories interactive map hero

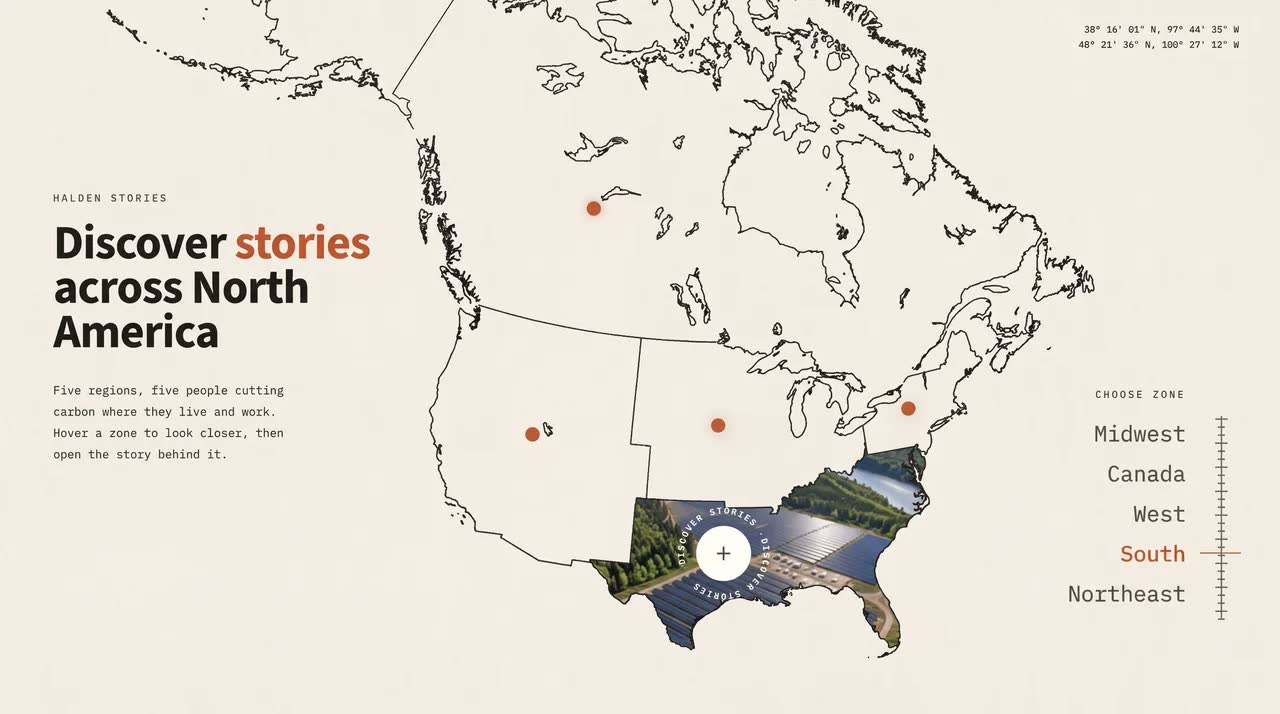
Build a single-file, one-screen **interactive storytelling map hero** for a fictional climate publication, **Halden Stories** ("Discover stories across North America"). Use plain HTML, CSS, inline SVG and vanilla JS, with no framework and no build step. The look is a light "field notes" atlas: a thin ink-line vector map of North America on warm off-white paper, small terracotta dots, monospace labels and a bold sans headline. Hovering a region fills it with a moving photo, and clicking opens a horizontal, draggable slider of coloured story cards.

## Media

- **Landscape grid photo:** `https://d2ol7oe51mr4n9.cloudfront.net/user_38xzZboKViGWJOttwIXH07lWA1P/1571669e-4604-4c0d-9e0d-5e50b819d55d.jpg` (2336×1744). One image holding a 3×2 grid of six landscape photos separated by white gutters. The cell edges are columns 0–766, 786–1551, 1571–2336 and rows 0–862, 880–1744.
  - **Top row:** a California reservoir with a dam; Midwest crop circles from the air; a solar farm in pine forest by a river.
  - **Bottom row:** offshore wind turbines and a lighthouse at sunrise; a hydro dam in autumn boreal forest in Québec; a spare cell (wind turbines over forest, unused).
- **Grid video:** `https://d2ol7oe51mr4n9.cloudfront.net/user_38xzZboKViGWJOttwIXH07lWA1P/efc53bc3-598a-4b28-b2a1-e72355301bac.mp4` (1664×1244, 4s, muted, loops seamlessly). The same grid with motion inside every cell: clouds and reflections, wheat, glints across the panels, turbines spinning, water pouring through the dam.
  - The last second crossfades into the first, so it loops without a jump and never plays in reverse.
  - Its cells sit at columns 0–545, 558–1104, 1117–1663 and rows 0–615, 626–1243.
- **People:** one photo per story, each a 3:2 documentary portrait in plain workwear (no logos):
  - Midwest: `https://d2ol7oe51mr4n9.cloudfront.net/user_38xzZboKViGWJOttwIXH07lWA1P/a72ef465-56f3-46e7-b441-8628db42c855.jpg`
  - Canada: `https://d2ol7oe51mr4n9.cloudfront.net/user_38xzZboKViGWJOttwIXH07lWA1P/39c763e2-0cef-4ad2-ae51-fa174d35220d.jpg`
  - West: `https://d2ol7oe51mr4n9.cloudfront.net/user_38xzZboKViGWJOttwIXH07lWA1P/91ef8d93-34e6-4167-93f5-db69e2be5c22.jpg`
  - South: `https://d2ol7oe51mr4n9.cloudfront.net/user_38xzZboKViGWJOttwIXH07lWA1P/b28bb368-0471-49a1-bb89-82fbd7898009.jpg`
  - Northeast: `https://d2ol7oe51mr4n9.cloudfront.net/user_38xzZboKViGWJOttwIXH07lWA1P/eb40a5b6-4553-4d6a-8681-5dc064fbfbc4.jpg`
- **How photos are drawn:** one hidden `<video>` (not `display:none`) plays the grid. Every photo on the page is a `<canvas>` that draws its cell from that video each frame with cover-crop maths. Use the still grid image until the video has data.
- **Rule:** nothing in the photos is drawn or animated in code. All motion inside them comes from the video.

## The map (real vector geography, inline SVG)

- **Source data:** generate the paths at build time from public data, not by tracing:
  - us-atlas `states-10m` (US states)
  - world-atlas `countries-10m` (Canada)
  - Natural Earth 50m lakes (Great Lakes, Winnipeg, Great Slave, Great Bear, Athabasca, Reindeer, Nipigon, Mistassini, Smallwood, Great Salt Lake and others)
- **Projection:** Lambert conformal conic (standard parallels 29.5° and 45.5°, central meridian 106°W). It's fitted by least squares to a 1440×810 frame so that, for example:
  - the Washington/BC coast sits at about (539, 343)
  - San Diego at (539, 600)
  - the tip of Florida at (1009, 733)
  - eastern Maine at (1107, 402)
- **Lines:** simplify every path to about 0.35px and drop islands smaller than 1.6px.
- **What is drawn:** 1.4px ink lines (`#1C1A17`, round joins, `vector-effect: non-scaling-stroke`):
  - Canada's coast, including the Arctic islands and Hudson Bay
  - the US outline (lower 48 plus the Alaska coast)
  - the borders between the four US Census regions: **West, Midwest, South, Northeast**. Merge states by dropping any arc shared by two states of the same region.
  - the lake shores
- **Cleanups:**
  - Drop the duplicate Canada/US border lines, and the straight Alaska–Yukon line.
  - Mask the country lines out of the lakes (a black-filled, 3.2px-stroked lake mask).
- **Clip shapes:** each region (and Canada) also exists as a clip path (`clipPathUnits="objectBoundingBox"`, scaled 1/1440 × 1/810), so an HTML layer can be clipped to the exact shape.
- **Entrance:** the lines draw themselves (`pathLength="1"`, stroke-dashoffset 1 → 0 over 1.7s, staggered).

## Frame and scaling

- **Frame:** one **1440×810 (16:9)** frame, scaled to fit the viewport and centred.
- **Overflow:** the map and story layer bleed past the frame to the screen edges, so there are never bands.

## Type and colour

- **Colours:** paper `#F6F3EA`, ink `#1C1A17`, secondary text `#3B3731`, terracotta `#C35933`.
- **Headline:** **Source Sans 3** 700, 54px on a 50px line, tracking −.022em. Card body text: Source Sans 3 400.
- **Mono:** **IBM Plex Mono** 400/500/600 for the eyebrow, paragraph, coordinates, zone list, card labels and city names.

## Map view (1440×810)

- **Intro block** at (60, 219):
  - eyebrow "HALDEN STORIES" (11px, tracking .24em)
  - headline "Discover **stories** / across North / America", with "stories" in terracotta
  - a four-line mono paragraph at 13.2px on a 24px line: "Five regions, five people cutting / carbon where they live and work. / Hover a zone to look closer, then / open the story behind it."
- **Coordinates:** top right, two mono lines at 10.2px: the active zone's lat/long, then a fixed "48° 21' 36" N, 100° 27' 12" W".
- **Zone list:** right side. "CHOOSE ZONE" at y = 443, then a right-aligned mono list at 25px on a 45px line: Midwest, Canada, West, South, Northeast. The active zone is terracotta.
  - Beside the list, a 230px vertical ruler with fine ticks. A terracotta marker slides along it to the active name.
- **Dots** (16px terracotta, with a pulsing soft halo):
  - Canada (668, 238), West (599, 492), Midwest (808, 482), South (814, 626), Northeast (1022, 463).
- **Active zone** (Midwest by default):
  - **Photo fill:** its photo fills the region shape, fading in over 650ms. The others fade out over 450ms.
  - **Ring:** its dot becomes a 62px off-white disc with a plus. Around it, "DISCOVER STORIES · DISCOVER STORIES ·" runs on a 45px-radius circle (`textLength` fitted to the circumference) and spins every 14s. The ring pops in with an expo ease.
- **Interaction:**
  - **Hover:** hovering a region, a dot or a list name activates that zone.
  - **Click:** clicking any of them opens its story.

## Story view

- **Transition** (1.25s, quintic in-out):
  - The map slides 520px left.
  - A story layer slides in from the right and stops beside a 72px paper strip, which shows a slice of the map lines and a "‹ Back" button.
- **Slider:** five stories in a row. Each story is a full-height **landscape photo panel** (0.74 × height) followed by a **colour card** (0.69 × height).
  - **Card contents:**
    - a "01 —— 05" counter with a progress line
    - the person photo inset at the top
    - "FIGHTING CLIMATE CHANGE", then the city in Plex Mono 600 at 42px, then a two-line body
    - the region's own outline faintly in the bottom right
    - a spinning "Discover stories" badge with a plus
  - **Card colours:**
    - Midwest (Des Moines): cobalt `#2F55D4`
    - Canada (Québec): ink `#23201C`
    - West (Sacramento): terracotta `#C35933`
    - South (Austin): forest `#1F4A35`
    - Northeast (Portland): mustard `#D99A2B` with ink text
  - **Entrance:** the card's photo wipes up while scaling down from 1.25, and its text rises in a stagger.
- **Dragging:**
  - Drag the track with the pointer. It rubber-bands at the ends, has momentum, and snaps to the nearest story with an expo ease over 900ms.
  - Photos parallax slightly inside their panels.
  - On fine pointers, the cursor over the track becomes an 80px cream disc reading "‹ DRAG ›", which shrinks while pressed.
  - Arrow keys move between stories. Esc or "‹ Back" returns to the map.
- **Timing:** all motion runs on the page's own clock (a long Web Animation's currentTime), so the scene can be recorded frame by frame.

## Phones and portrait tablets

- **Layout:** no frame scaling.
- **Intro:** at the top, over a paper fade.
- **Map:** scaled to fit the middle.
- **Zones:** a row of pill chips at the bottom that scrolls to the active one.
- **Stories:** full width, with the photo at the top 42% and the card below.

## Acceptance check (1440×810)

- The map lines match real geography and draw in on load.
- Hovering West, then South, fills each region with its moving photo, and the ring, list highlight, ruler marker and coordinates follow.
- Clicking South slides into the Austin story. Dragging left snaps to Portland, and Back returns to the map.
- **Content:** no real brands or logos.شرایط و تحویل
دانلوددسترسی فوری پس از پرداخت
مالکیتاستفادهٔ تجاری مادامالعمر
آپدیتبهروزرسانیهای کتابخانه رایگان
پشتیبانیراهنمای نصب و پاسخ به سؤالات
امتیاز و نظرها
0.0/5
0 نظر ثبتشده
نظرتان را بنویسید
تجربهتان از این آیتم را با دیگر مشتریان به اشتراک بگذارید.